The Parlour in downtown Durham is a happy place where the line for ice cream often overflows out the door. Children enjoy their cones on the plaza outside and chase each other around the city’s landmark bull statue as their parents look on.
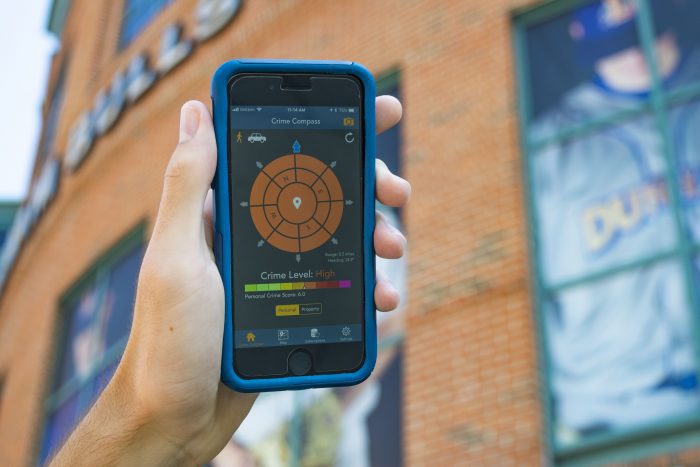
Those parents probably don’t know they’re about 16 times more likely to be robbed and eight times more likely to be murdered on that plaza than the national average. At least, that’s what it says in Crime and Place, a remarkable new iPhone app that tells you the risk of crime for your location.
Sorry for ruining dessert.
Crime and Place calculates the likelihood of murder, rape and assorted other crimes by distilling reams of data from the FBI’s Uniform Crime Reports. It simplifies that data into a score from 1 to 10 for every census block group in the United States. The app uses maps and a “Crime Compass” with shades of red, orange, yellow and green that tells users not only how safe they are, but essentially how to escape high-crime areas.
That approach bothers some policy experts, including Robert Korstad, a Duke professor of public policy and history who has researched Durham extensively, and Martine Aurelien, policy fellow at the North Carolina Justice Center. They say the app has some useful features but fails to account for fluctuations in crime during different seasons and times of day. They’re also concerned that it can reinforce stereotypes about race and crime and that it fails to account for users’ race and gender, which influences how likely they are to be the victim of crimes.
Korstad called the app “both impressive and horrifying.”
Pointing you to safety
For just $15 plus $5 for a year’s worth of data, Crime and Place will tell you where the crime is.
As you drive through Durham (or any other city), the app’s compass changes colors, giving you an escape route to get away from the bad guys. Drive around Durham and you’ll see it go from green (“low”) to yellow (“average”) to light orange (“elevated”) to red (“high”). When areas of the compass start to turn yellow or green, you can follow them to escape to safety. (For more details, see A trip through Durham with the Crime Compass.)
The app’s user manual offers some advice for road trips: “Try to stop for gas, meals, etc. when the compass shows green. Avoid stopping when the compass shows red.”

Most of Duke’s campus is in a yellow “average” zone, but walk to Ninth Street for brunch at Elmo’s and the crime level becomes “elevated.” That’s still a safer meal than in the heart of downtown at Pompieri Pizza or The Pit, where it’s “high.” Hope Valley Country Club is in a “low” region, but that isn’t true for all of Durham’s wealthy neighborhoods — crime is “elevated” at Croasdaile Country Club.
If you want the app to keep you safe without having to watch it constantly, you can set a threshold for notifications that shout, “Entering high crime area!” whenever the rating rises above your chosen number.
The people who created Crime and Place say its meticulous data modeling makes it better than other crime apps. It reflects long-term crime trends with separate models for all nine census regions in the country and for the seven types of personal and property crimes.
Indeed, the app does some impressive math. For each area, it calculates a separate number for murder, rape, robbery and assault to create an overall personal crime score. It also tallies a property crime score using burglary, larceny and auto theft. It shows those scores relative to the national average, which is 4.0.
Each additional point on the scale doubles the likelihood of crime relative to the 4.0 national average. So at the Durham Bulls’ ballpark and the Durham Performing Arts Center, the 8.1 robbery rating means you’re more than 16 times more likely to be robbed than the national average.
Crime and Place’s lead developer, Jolly Salehy, said the app is primarily intended to inform people visiting unfamiliar cities or looking to buy a home, but he acknowledged it could change how people view their own hometowns.
“A lot of us had similar stories of business trips where you’re sitting in a rental car or you’re in an unfamiliar city and you end up somewhere that is unsafe, and then you start to get that panicky feeling,” Salehy said. “Living in a place for a while, you get a feel for where is generally safe and where is generally unsafe, so it possibly has limited use in those cases, although we have had some people that end up being kind of surprised.”
Avoiding the red in Durham: An impossible challenge
In front of the Duke Chapel, the personal crime score is 4.9, just low enough to sneak into the average range, and most of the compass is yellow except for one orange slice in the southern tip of campus.
The maps on the app show how arbitrary the differences between those labels can be.
The border between “average” and “elevated” crime is roughly the 50-yard line at Wallace Wade Stadium. Visiting teams looking at the compass from their locker room would feel less safe in Durham than Duke’s players in the home locker room on the other side of the stadium.

Drive across Cameron Boulevard to the Duke Faculty Club or go for a run around the Al Buehler Trail and you’ll be in an “elevated” orange region throughout your workout. The Duke professors and physicians who drive a couple of miles down Academy Road to drop their children off at the Durham Academy middle school may be alarmed to see that their 10-year-olds are walking on the sidewalks to class in an “elevated” region, too.
The darkest shade of red in Durham is around Durham Tech Community College and the McDougald Terrace public housing complex southeast of downtown. The personal crime score is as high as 7.3, and murder and robbery ratings are 8.3. The Crime Compass calls it “high.”
That red region borders North Carolina Central University, a historically black public college, and roughly correlates with the old Hayti neighborhood when the city was segregated. Today, the area is home to much of Durham’s low-income housing.
“Looking at that app and understanding the history of Durham, I think it just helps just to corroborate an unfortunate narrative that has already been in place,” Aurelien said.
Other crime apps have been driven out of existence after being labeled as racist. SketchFactor, a crowdsourcing app in which the public could assign subjective ratings to points on a map and submit comments — The Washington Post reported that one comment criticized “homeless crackheads” — was rebuked upon its launch in 2014 and is no longer available.
Aurelien said Crime and Place is more reputable because it uses pure data, but she acknowledges it could provide more nuance to help overcome stereotypes if it presented the rate of change of crime.
Since predominantly black areas often overlap with low-income areas in Durham, wealthier white neighborhoods already have a head start with a lower initial crime rate. But if people can see that the crime rate in a poor community is decreasing, they might be more encouraged to shop, eat or even buy a house there.
The app’s emphasis on longer time periods makes it more resistant to outliers and randomness from quarter to quarter, but with such a large time range, users don’t know whether an area is red because of something that happened two months ago or two years ago.
“Although it might be red, if the app provided how this changed from five years ago, two or three years ago, sometimes people aren’t just interested in knowing and understanding whether crime is prevalent but also understanding if it’s growing, decreasing or remaining stagnant,” Aurelien said.
Salehy said the app’s creators talked about the influence of racial stereotypes before launching Crime and Place in 2016 and called it a “touchy subject,” but decided there was no harm in repackaging public information.
“That was one of the things we kind of struggled with early on — how is this going to be interpreted by the public? Will this be kind of taken the wrong way? Will this seek to reinforce stereotypes?” Salehy said. “At the end of the day, all we’re doing is facilitating visualization of some data. We can’t control how our customers choose to interpret that or the decisions that they make based on that.”
Criminals come out at night
Aurelien noted that the app doesn’t change based on the time of day, but crimes do. Many crimes are more likely to occur when it’s dark.
“There are some areas where there’s only a handful of petty crimes that occur during the day, but the mood completely changes at night,” Aurelien said.
The app’s ratings also do not shift by season even though some crimes are more common during the summer when more people are outside.
Korstad’s biggest qualm with the app is that it doesn’t have any way to evaluate how susceptible each user is to crimes.
He said it would be useful if he could punch in demographics such as, “White college professor with a PhD driving a big car that has plenty of speed and plenty of gas,” and the app would customize a prediction on his likelihood of being a crime victim.
Korstad said using objective data instead of anecdotes also does not make the app immune to claims of prejudice.
Although the first sentence of Crime and Place’s methodology page boasts that it presents “well established, long term trends in criminal activity in the United States,” Korstad said there is a difference between criminal activity and crime rates. Criminal activity is not always caught or enforced by police, who often monitor and arrest people in minority communities at a disproportionately high rate.
“If I was interested in criminal activity around drugs, I know that one of the major places for criminal activity involving drug possession, drug sales and drug use is the Duke University campus,” Korstad says. “Because the police aren’t enforcing the law and they aren’t arresting or trying to arrest Duke students, it skews these numbers.”
That raises another issue that makes the app’s data incomplete: Crime and Place doesn’t include data on drug crimes at all. The seven crime categories it tracks make up Part I of the FBI’s Uniform Crime Reports, and drug offenses all fall under Part II, making the app’s claim that it “paints a more accurate picture of overall crime levels in a given area” only partially true.
(Photo at top by Katie Nelson)
Hank Tucker


Comments are closed.